Cell Ranger7.1, printed on 04/09/2025
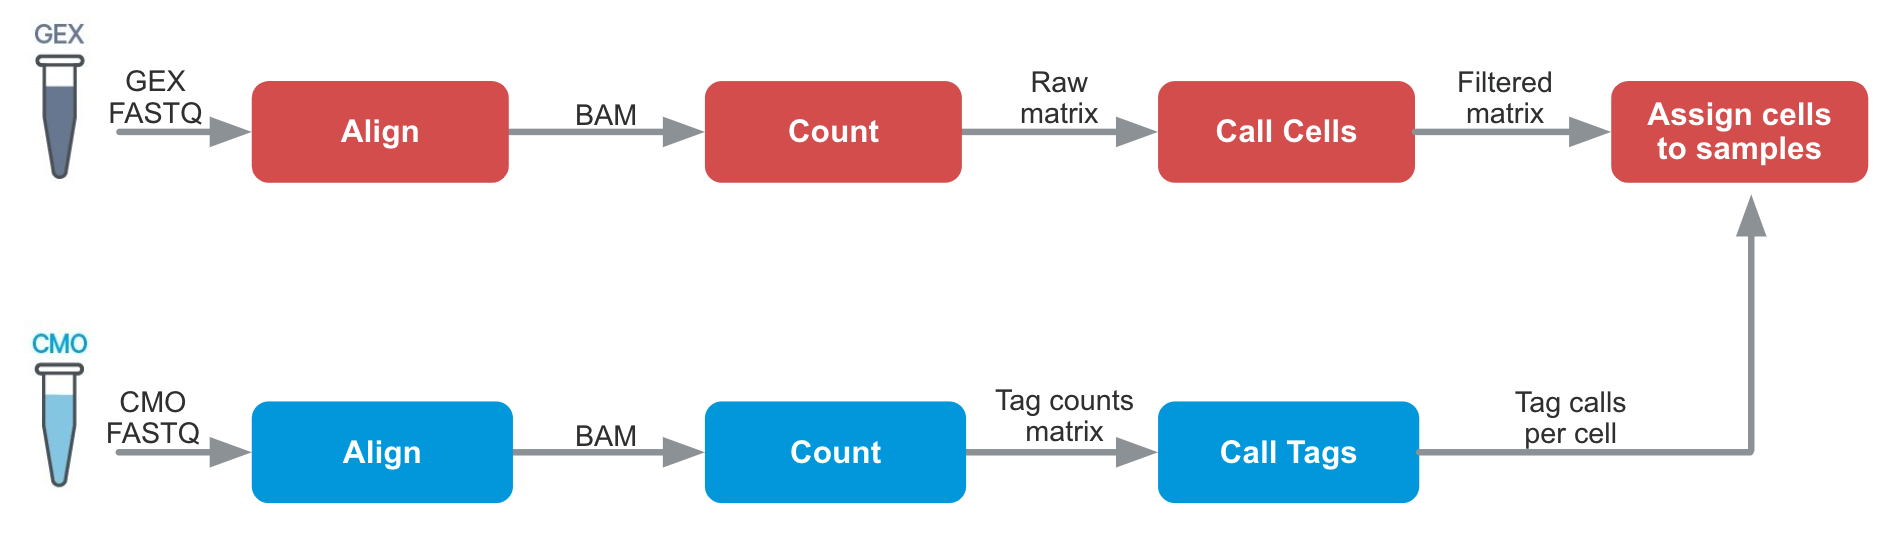
Cell Ranger 6.0 introduced support for Cell Multiplexing with the cellranger multi pipeline. The algorithms are similar to cellranger count in many ways, but an additional tag calling step is required:
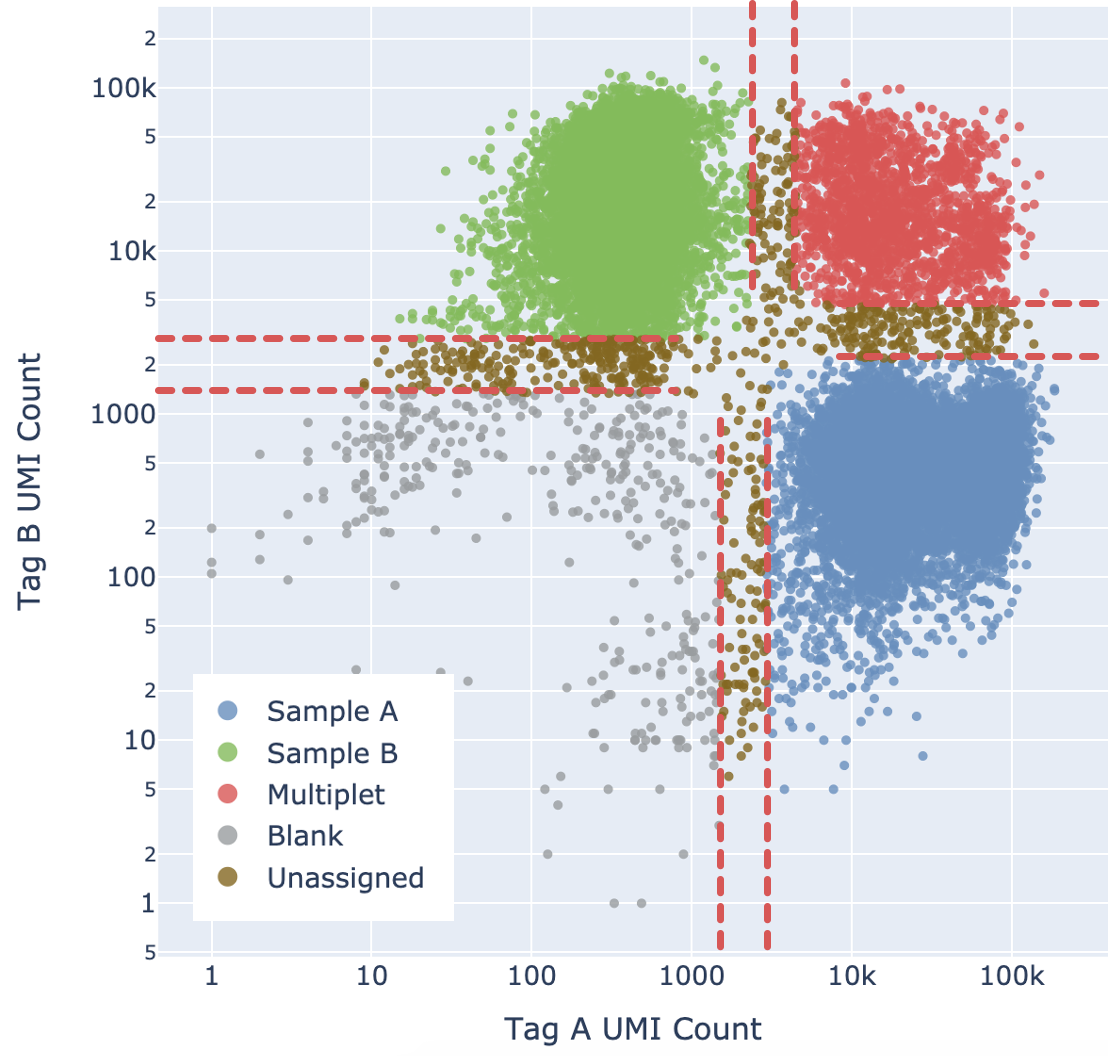
Cell-associated barcodes are identified as singlets, multiplets, or blanks (considered to have lower than expected tag counts for all tags used) according to a probabilistic model. A key benefit of this algorithm is the ability to detect and filter most multiplets and blanks from the data.
Cell Ranger 6.0 and later features a probabilistic model for assigning Cell Multiplexing Oligo (CMO) tags to cell-associated barcodes. The algorithm employs a latent variable model over a state space composed of each sample used in the experiment. To make the algorithm computationally tractable, the model explicitly accounts for the type and quantity of the different multiplets expected. For example, there is a “Blanks” state for barcodes associated with cells that have not been stained with any tag, a singlet state for each tag used in the experiment, and different states for each type of multiplet based on how many tags were used (up to 12 supported).
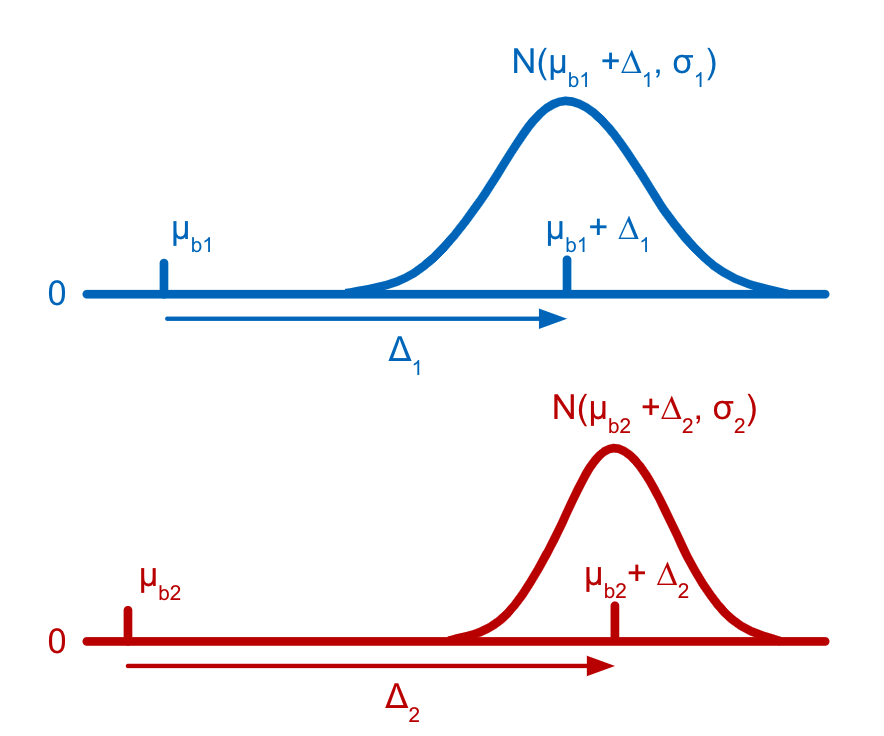
Each tag is assumed to have a distribution of counts amongst cells that have not been stained with the tag (background distribution) and another distribution of counts amongst cells that have been stained with the tag (signal distribution). Both the background and the signal distribution are assumed to be Gaussian with different means but the same variance. The parameters for the distributions of counts for latent states are efficiently derived as linear combinations of the individual cell-states (stained or not) present in the latent state, allowing states which are rarely, or never, observed in the data to still be accurately estimated. The parameters for the Gaussian distributions and the latent state assignments for each barcode are estimated using a customization of the Expectation-Maximization (EM) algorithm (Dempster et al., 1977).
Cell Ranger models the count distribution of each CMO tag with the following assumptions:
When the EM optimization converges, Cell Ranger calculates, for each barcode, the probability that it belongs to each latent state in the model. Following this, Cell Ranger combines all the different multiplet states into one coarse-grained Multiplet state by summing their probabilities.
For each barcode:
Cell Ranger adds a fifth "Unassigned" category for cells that cannot be confidently assigned to any other state. This is done by enforcing a minimum confidence threshold to filter out low confidence assignments, as detailed below in the “Confidence thresholding” section. Being more stringent about the minimum confidence necessary to make an assignment results in greater accuracy (lower mis-assignment rate) at the cost of yield (fewer singlets).
Ultimately barcodes that are classified as Multiplet, Blanks, or Unassigned are filtered out. Note that the algorithm cannot filter out multiplets containing only one tag.
There is an inherent trade-off between yield (number of singlets assigned a single tag) and accuracy (as defined by the rate of mis-assignment). Being more stringent about the minimum confidence necessary to make an assignment results in greater accuracy (lower mis-assignment rate) at the cost of yield (fewer singlets).
Based on analysis of the yield-accuracy tradeoff in representative datasets, a default minimum confidence threshold for assignments was set at 0.9. (Since these probabilities are not exact, this corresponds typically to a mis-assignment rate significantly less than 1%.) When the most likely state for a barcode has a likelihood of less than 0.9, we label it as "Unassigned". Only barcodes with a singlet likelihood of 90% or greater are considered singlets by the model and assigned to a sample.
For particular datasets of interest, the user may wish to tolerate a higher rate of mis-assignment in order to obtain more singlets to include in their analysis, or a lower rate of mis-assignment at the cost of obtaining fewer singlets. As of Cell Ranger 6.0.2, users can adjust the default threshold by changing the min-assignment-confidence parameter in the multi config CSV file.
Some of the metrics and algorithms in the CellPlex processing pipeline rely on correct estimation of the number of singlets and multiplets in the reaction - i.e., cell barcodes that were stained by one, two, or more CellPlex tags. That Poisson calculation depends on the cell load and the number of GEMs generated during a Chromium run. While the number of cells is a variable based on the actual number of loaded cells and what Cell Ranger detected, the number of GEMs is unique to each 10x Genomics chip. In Standard Kit (SK) chips, about 95,000 GEMs are generated, while in High Throughput (HT) chips, about 190,000 are generated.
For CellPlex data, Cell Ranger 6.1 attempts to correctly detect throughput to update the number of GEMs in downstream calculations, so metrics like Singlet Capture Ratio are produced correctly.
| Throughput detection is not necessary for non-CellPlex data as the multiplet ratios are not calculated. Since these calculations are only important for 3' CellPlex experiments, Cell Ranger 6.1 runs throughput auto-detection when it detects both GEX and CMO libraries. |
Shown below are the knee plots of an SK run (left) and an HT run (right). The plots are on a log-log scale. The UMI count profile is different for barcodes between the 95,000-190,000 region for SK vs. HT runs. In the first step, two algorithms are run in parallel which independently attempt to determine the throughput. The first one looks at the ratio of the UMI count of the 130,000th barcode divided by the UMI count of the 100th barcode and decides whether that is significantly high; the second one finds the steepest cliff in the barcode rank plot after the 70,000th barcode and determines if that cliff happens after the 130,000th barcode (red lines). The blue lines indicate barcodes 70,000 and 220,000.
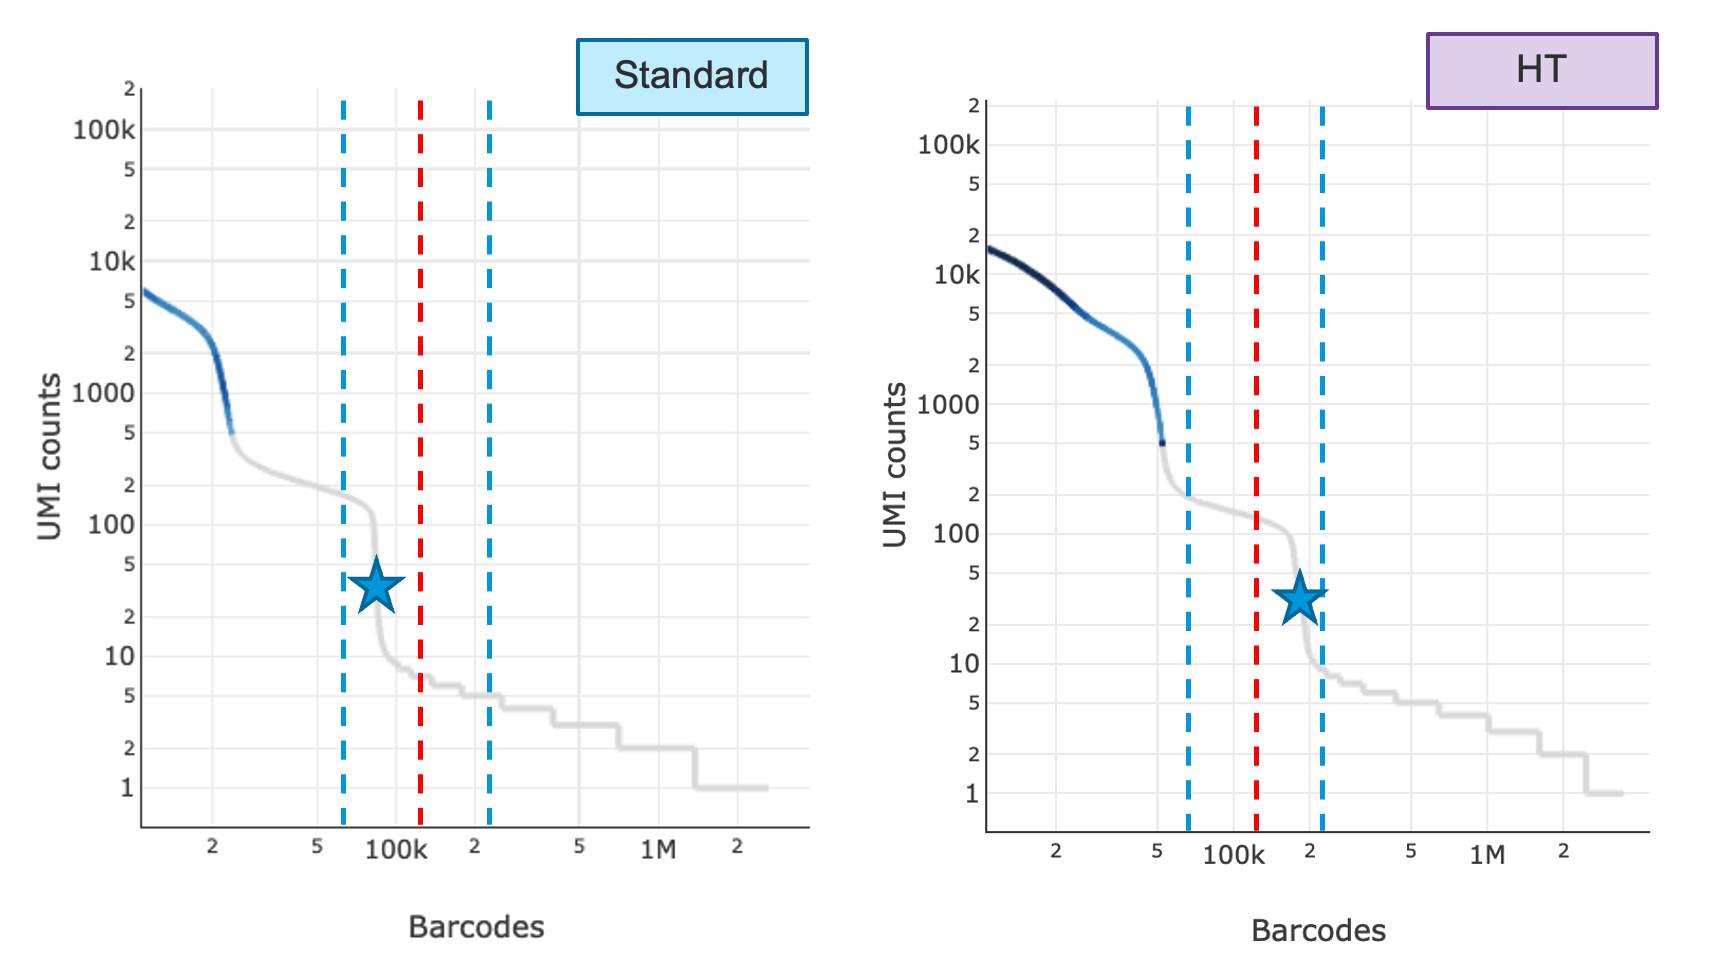
In the second step, the pipeline compares the results of both algorithms. If both decisions were returned as true, the final throughput will be chosen as HT and number of GEMs used for Poisson calculation will be 190,000, otherwise the software will default to SK and number of GEMs to 95,000. If it detects an HT run, the web summary will show 'HT' appended to the detected chemistry. If the algorithms fail, users can choose to run with chemistry=SC3Pv3HT to indicate HT, where Cell Ranger 6.1 will use HT defaults for downstream calculations. If the throughput detection algorithm does not detect HT where user has indicated HT, the software will report an alert on the web summary describing the throughput discrepancy.
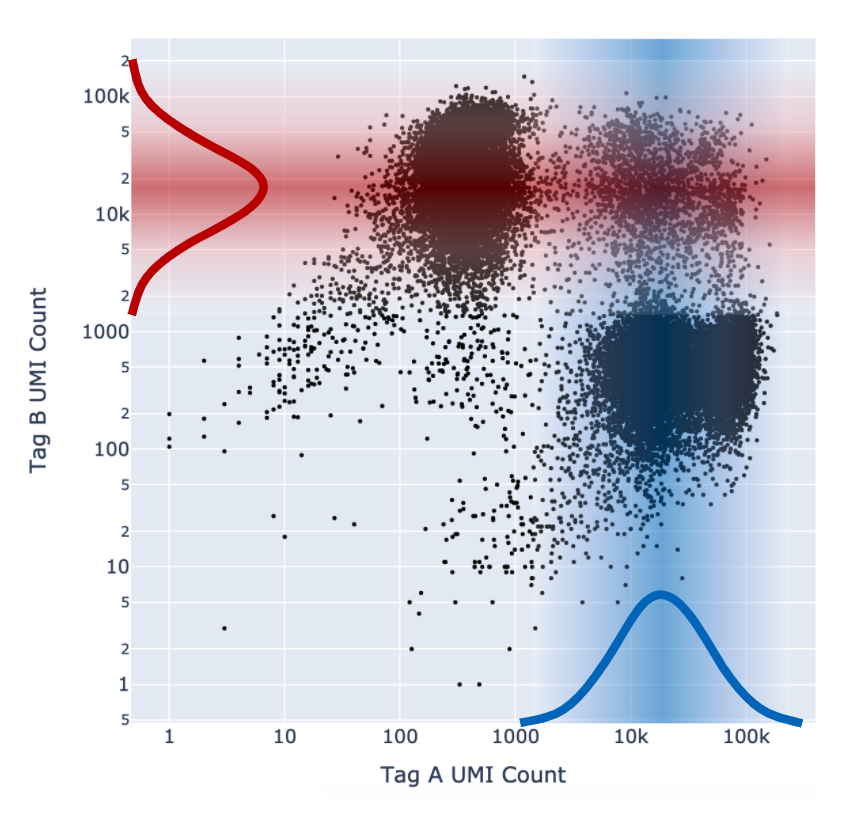
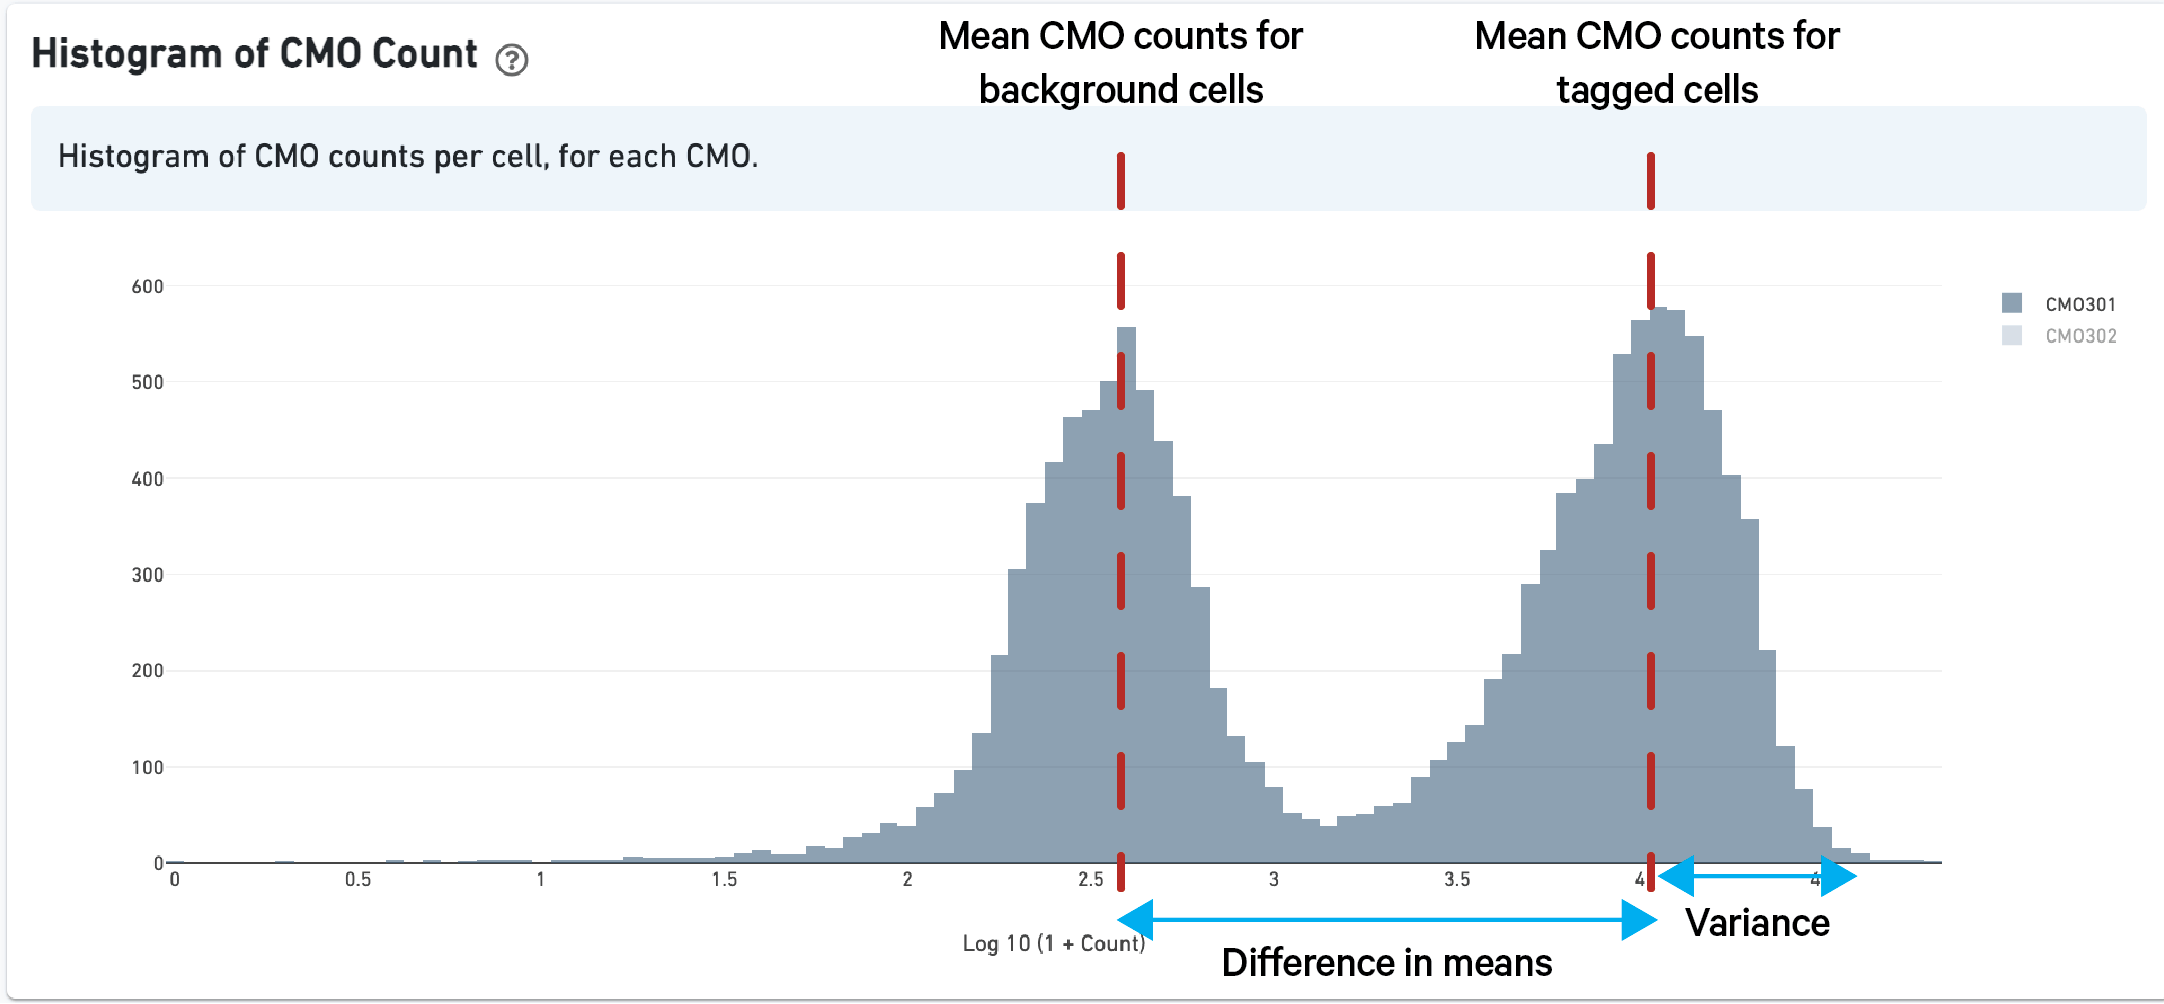
As described above in the cell tagging algorithm section, each CMO tag is assumed to have a background distribution of counts amongst cells that have not been stained with the tag (left, noise distribution) and another foreground distribution of counts amongst cells that have been stained with the tag (right, signal distribution).
Higher signal-to-noise ratios can help to indicate whether there is sufficient separation between the distributions for clean tag assignment. The histogram of CMO counts and CMO signal-to-noise ratio are displayed on the multi web summary output Multiplexing tab.
This ratio is computed as the difference between the mean background (left, noise distribution) and foreground (right, signal distribution) CMO counts on a log scale divided by the variance (assumed to be the same for both peaks), illustrated below for CMO301:
Dempster AP, Laird NM, and Rubin DB. Maximum likelihood from incomplete data via EM algorithm. J R Stat Soc Ser B Methodol. 39:1–38, 1977.