Cell Ranger5.1, printed on 04/11/2025
Loupe V(D)J Browser includes a variety of tools to explore the diversity of clonotypes across your entire sample and to hone in on individual clonotypes, genes, motifs, or even individual cell barcodes.
In the rest of this tutorial, we will use the T cell spike-in dataset to explore clonotypes that associate with the COVID antigen, examine genes that make up their TRA and TRB chains, and assess the antigen specificity scores of other clonotypes in the dataset.
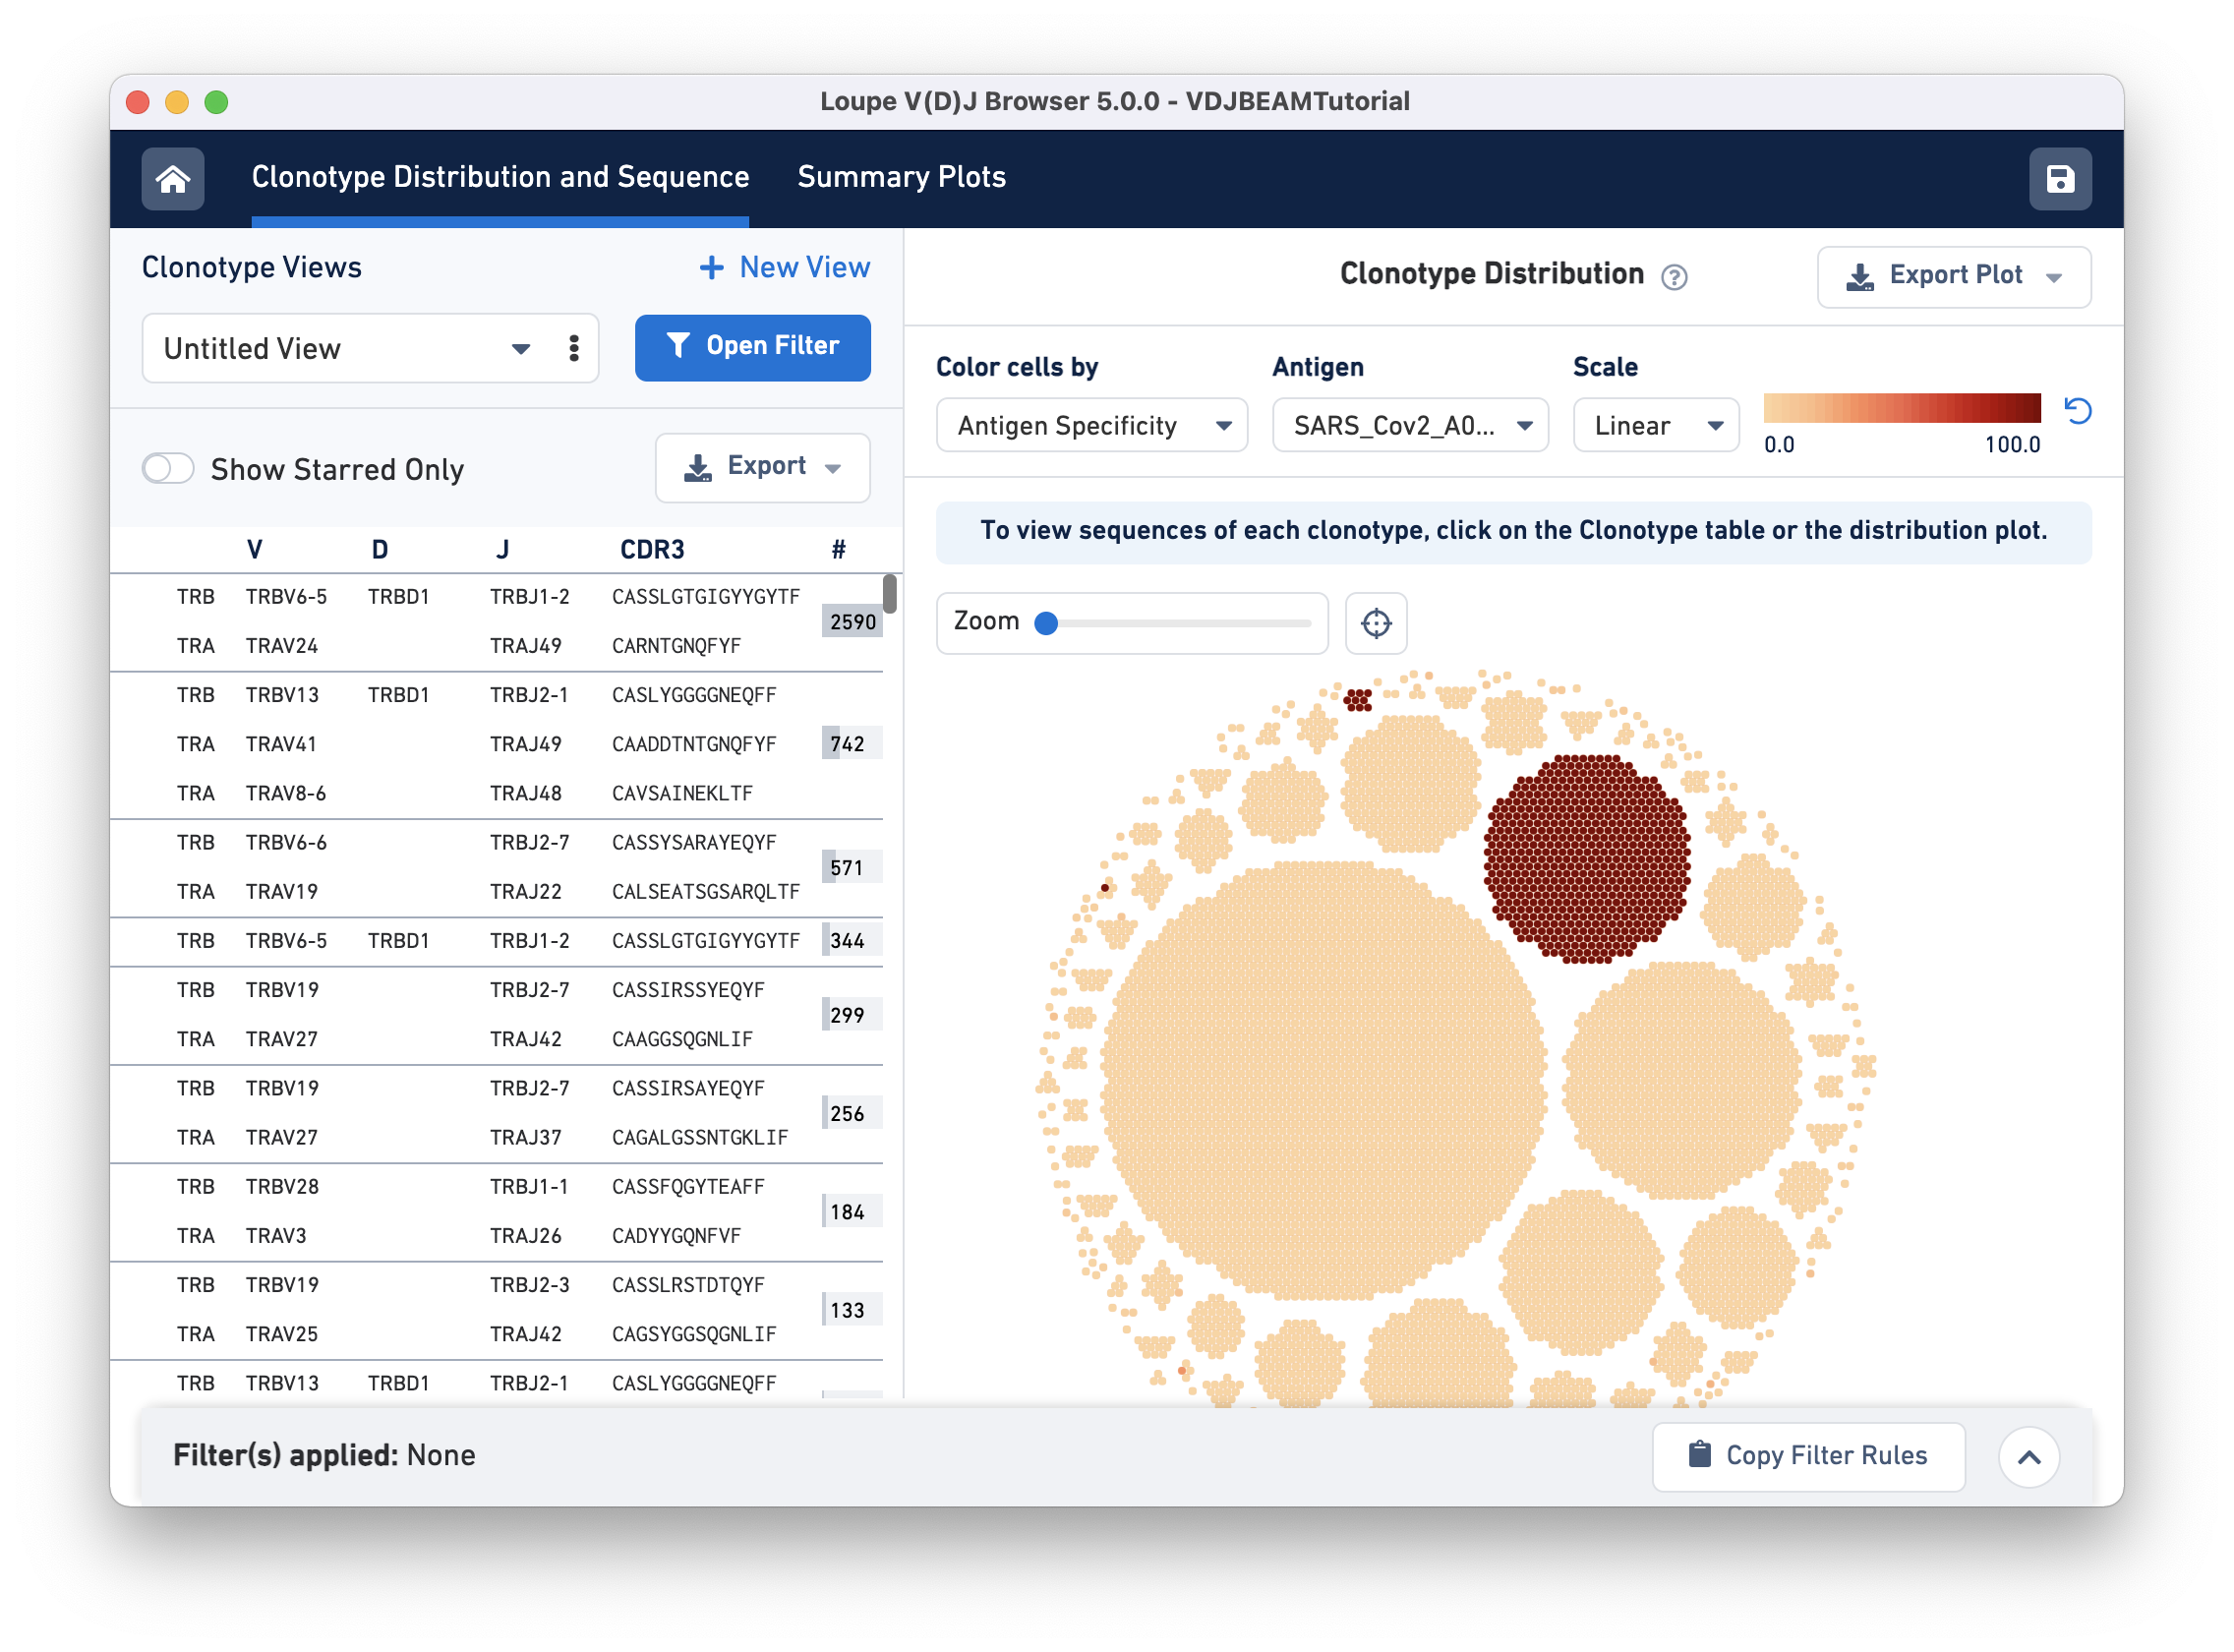
The Clonotype Distribution plot is a visual representation of all clonotypes in the dataset. Each dot is a cellular barcode (or cell) with an assembled, productive, and high-confidence V(D)J receptor. Cells in a group belong to the same clonotype and white space separates the clonotypes. Large clonotypes are in the middle and smaller clonotypes are at the periphery.
To visually identify clonotypes that bind to the SARS-CoV-2 (COVID) antigen, we will color cells by their SARS_Cov2_A0201 antigen specificity score. Two main clonotypes appear to have high specificity scores for the COVID antigen:
For V, D, and J gene information, hovering on the clonotype will highlight the corresponding row in the left panel (if that clonotype is in view):
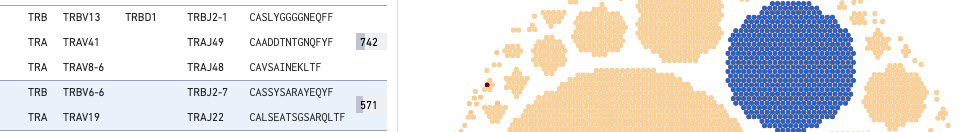
This large COVID antigen-associating clonotype has 571 cells (barcodes), with the TRA chain expressing TRAV6-6 (V gene) and TRBJ2-7 (J gene), and the TRA chain expressing TEAV19 (V gene) and TRAJ22 (J gene). Neither chain expresses a D gene.
Click on the clonotype to enter the Sequences view. When you first click on a clonotype, you will see gray bars of various widths. The row marked Universal Reference sequence is a concatenation of the reference sequences of each gene detected in the chain. The next row is the Donor Reference sequence or the inferred germline sequence for the V gene based on common mutations shared between single T or B cells from a single donor. The row marked Consensus is the chain consensus sequence, a sequence that represents the sequence of the first exact subclonotype for a receptor chain within the clonotype.
Below the consensus sequence are (one per row) the sequences of all the exact subclonotypes (cells in a clonotype with identical immune receptor nucleotide sequences). In this example, there are two exact subclonotypes; the larger one has 570 cells and expresses both TRA and TRB chains, whereas the smaller one has only one cell-associated barcode that only expresses a TRA chain.
The gray backgrounds indicate where the sequences align with the reference. As you can see, the beginning and end (5′ and 3′ ends) of the donor reference sequence are white, indicating that the donor reference sequence covers only the V gene and not the 5′ UTR, or J gene. When the end of an exact subclonotype row is white, it indicates that the assembled contigs in that exact subclonotype did not span the entire sequence of the reference.
There are a series of vertical lines or blocks of various colors across some of the rows. Each indicates a feature of interest, such as a start codon or a variation from the reference. The legend at the top shows what features each color represents. Usually, start codons appear at the very beginning of the V gene annotation.
To get the antigen specificity score for this clonotype, use the Select Antigen (s) drop-down menu option and select 'SARS_Cov2_A0201'. It is possible to choose more than one antigen using this menu. A blue box appears in each row under the Antigen Specificity column. Hovering over the box reveals the name of the antigen(s) selected and their corresponding antigen specificity scores, as shown here:
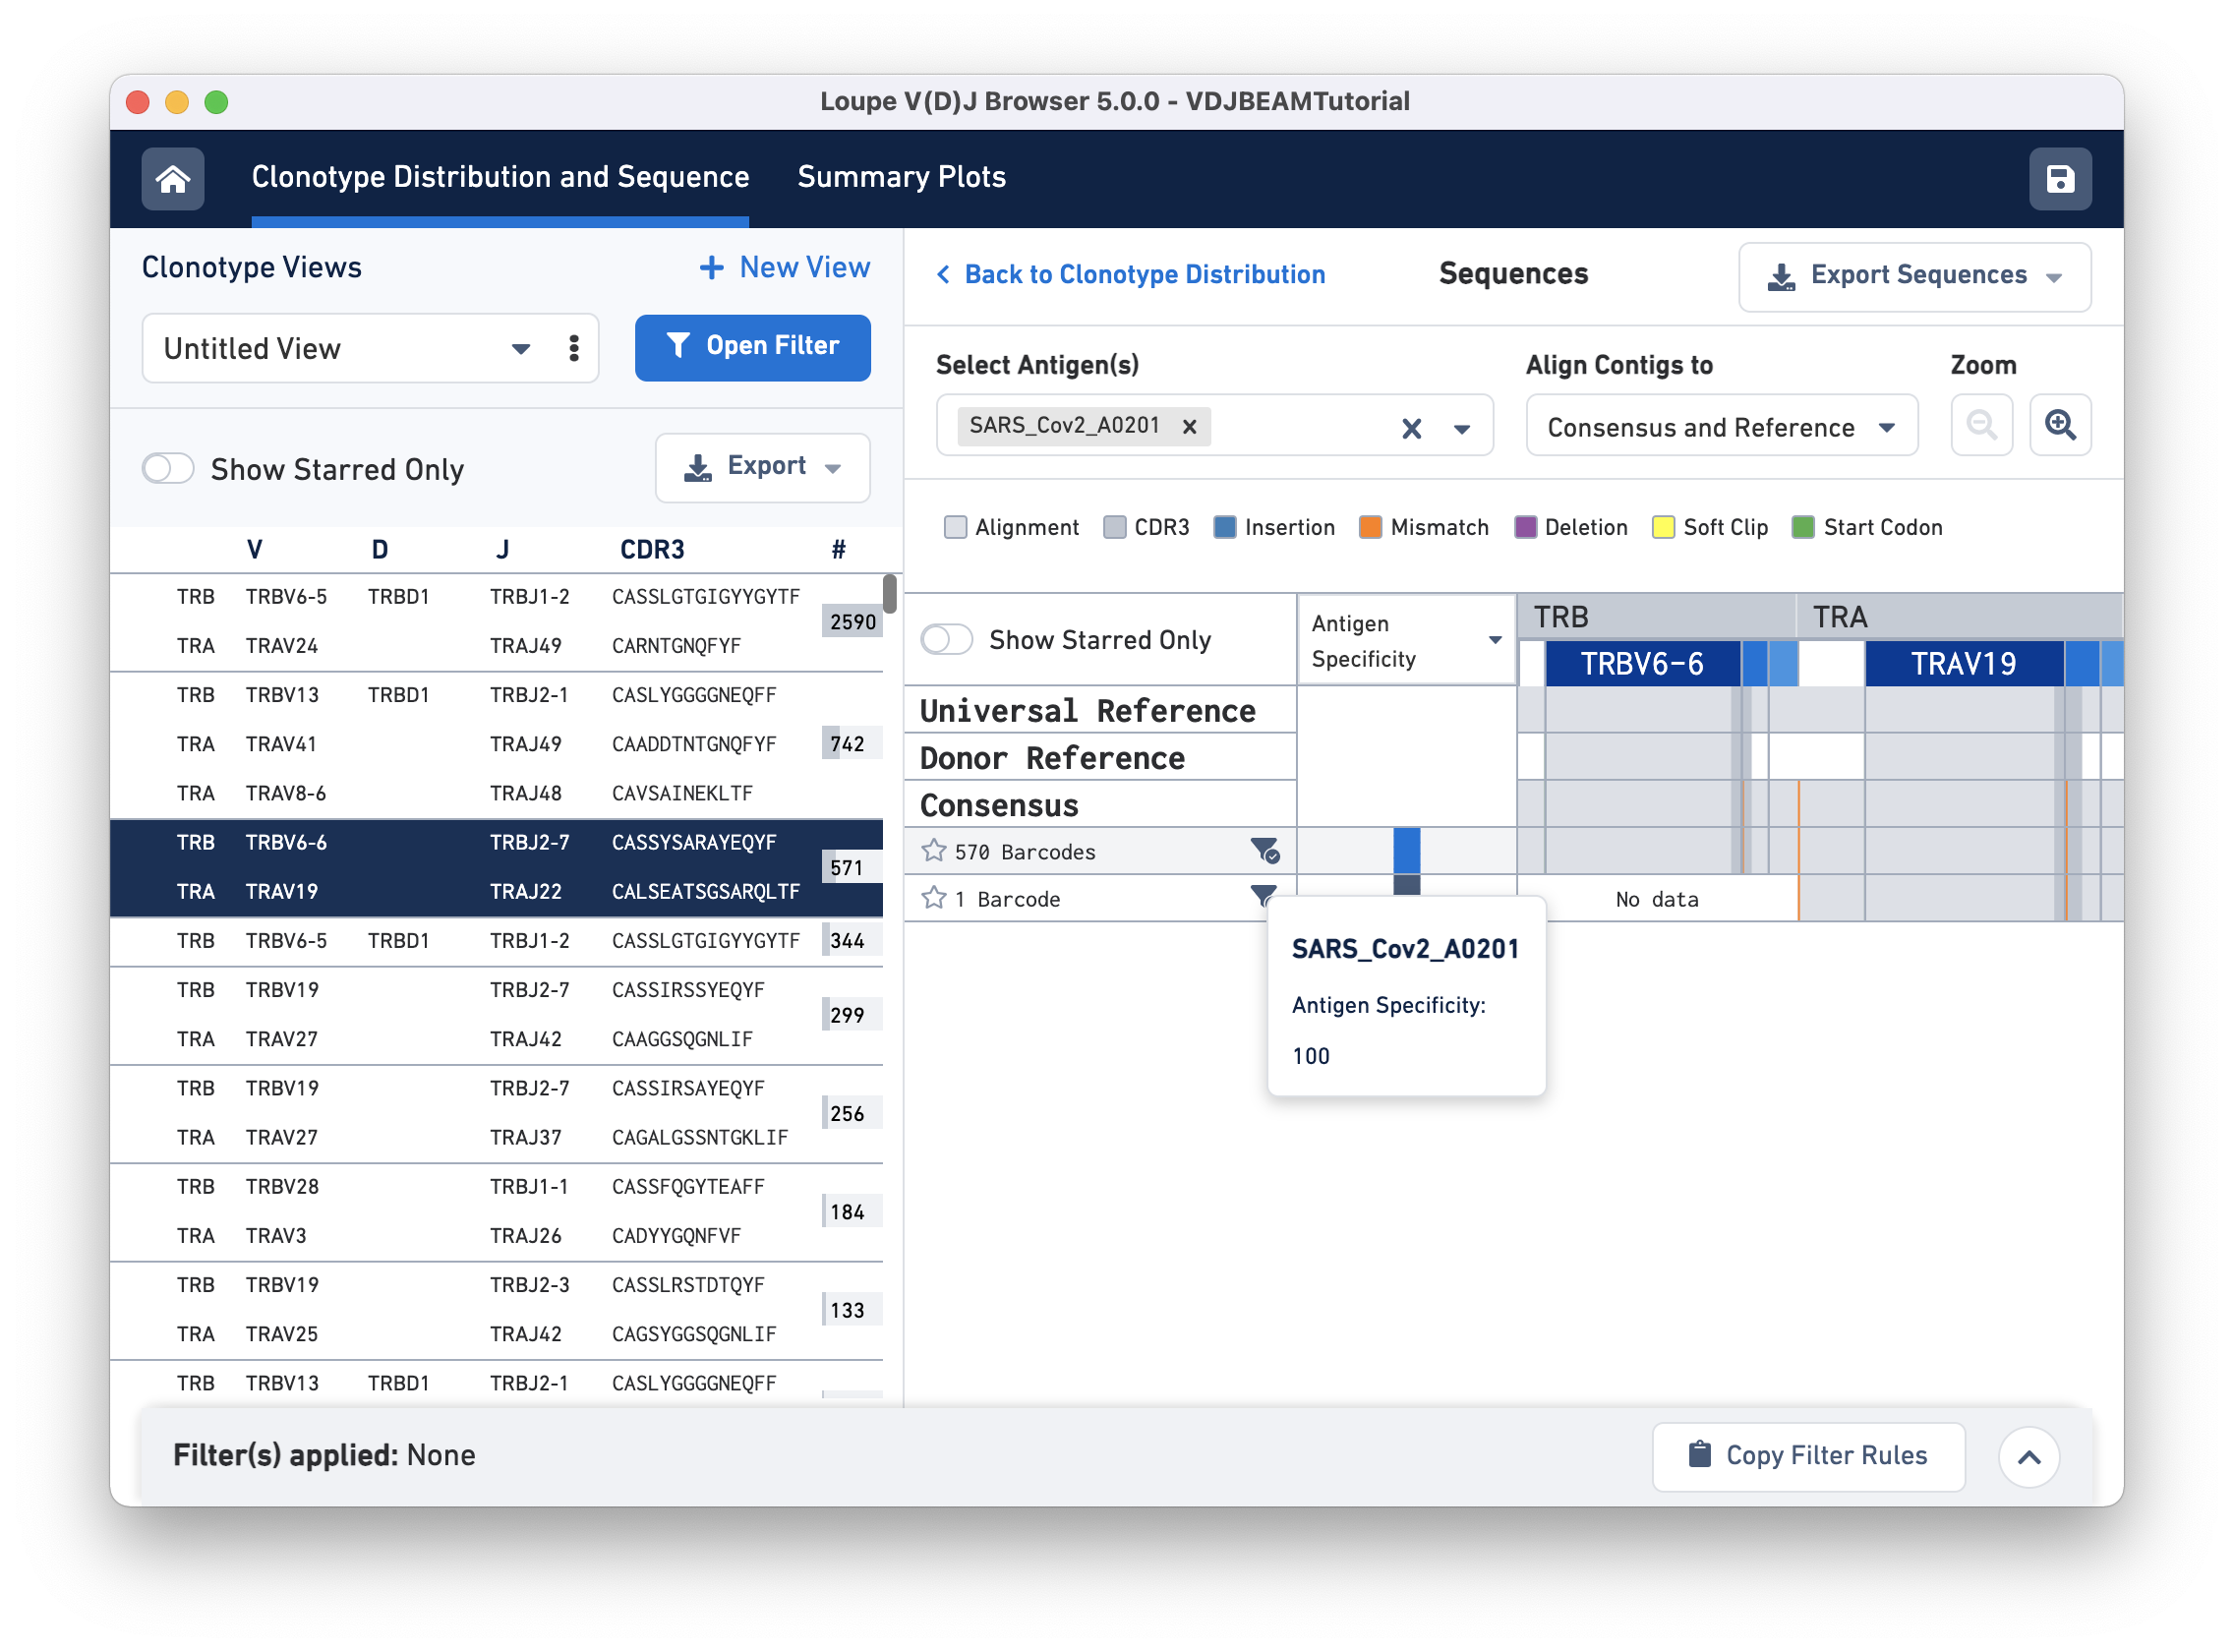
You may also view mean UMI counts for that antigen instead of antigen specificity by using the column header drop-down menu option. If the antigen specificity score or UMI count per antigen is low, the box appears white (with diagonal grey lines).
Somatic cells are not just characterized by their V, D, and J genes; the addition and deletion of bases at gene junctions during V(D)J recombination further contributes to T cell diversity. Because of this additional variability, areas around gene junctions will often appear to have many mutations compared to a canonical reference. Note, however, that the consensus sequence here has the same variants as the contigs since it comes from the first exact subclonotype in the table.
While it is useful to see the common mutations around gene junctions, they make it difficult to assess how closely the contigs map to the consensus sequence. You can more easily do this by visually aligning the contigs to the shared consensus sequence. To do so, click the selector above the gene annotations and select Align Contigs to Consensus.
Switching to the consensus alignment view hides common intra-junction variability. In this case, there is no difference (no mismatches, insertions, or deletions) between the exact subclonotypes. Although these two subclonotypes have identical contigs, as discussed earlier, they are not grouped into a single exact subclonotype because one contig does not express a TRB chain.
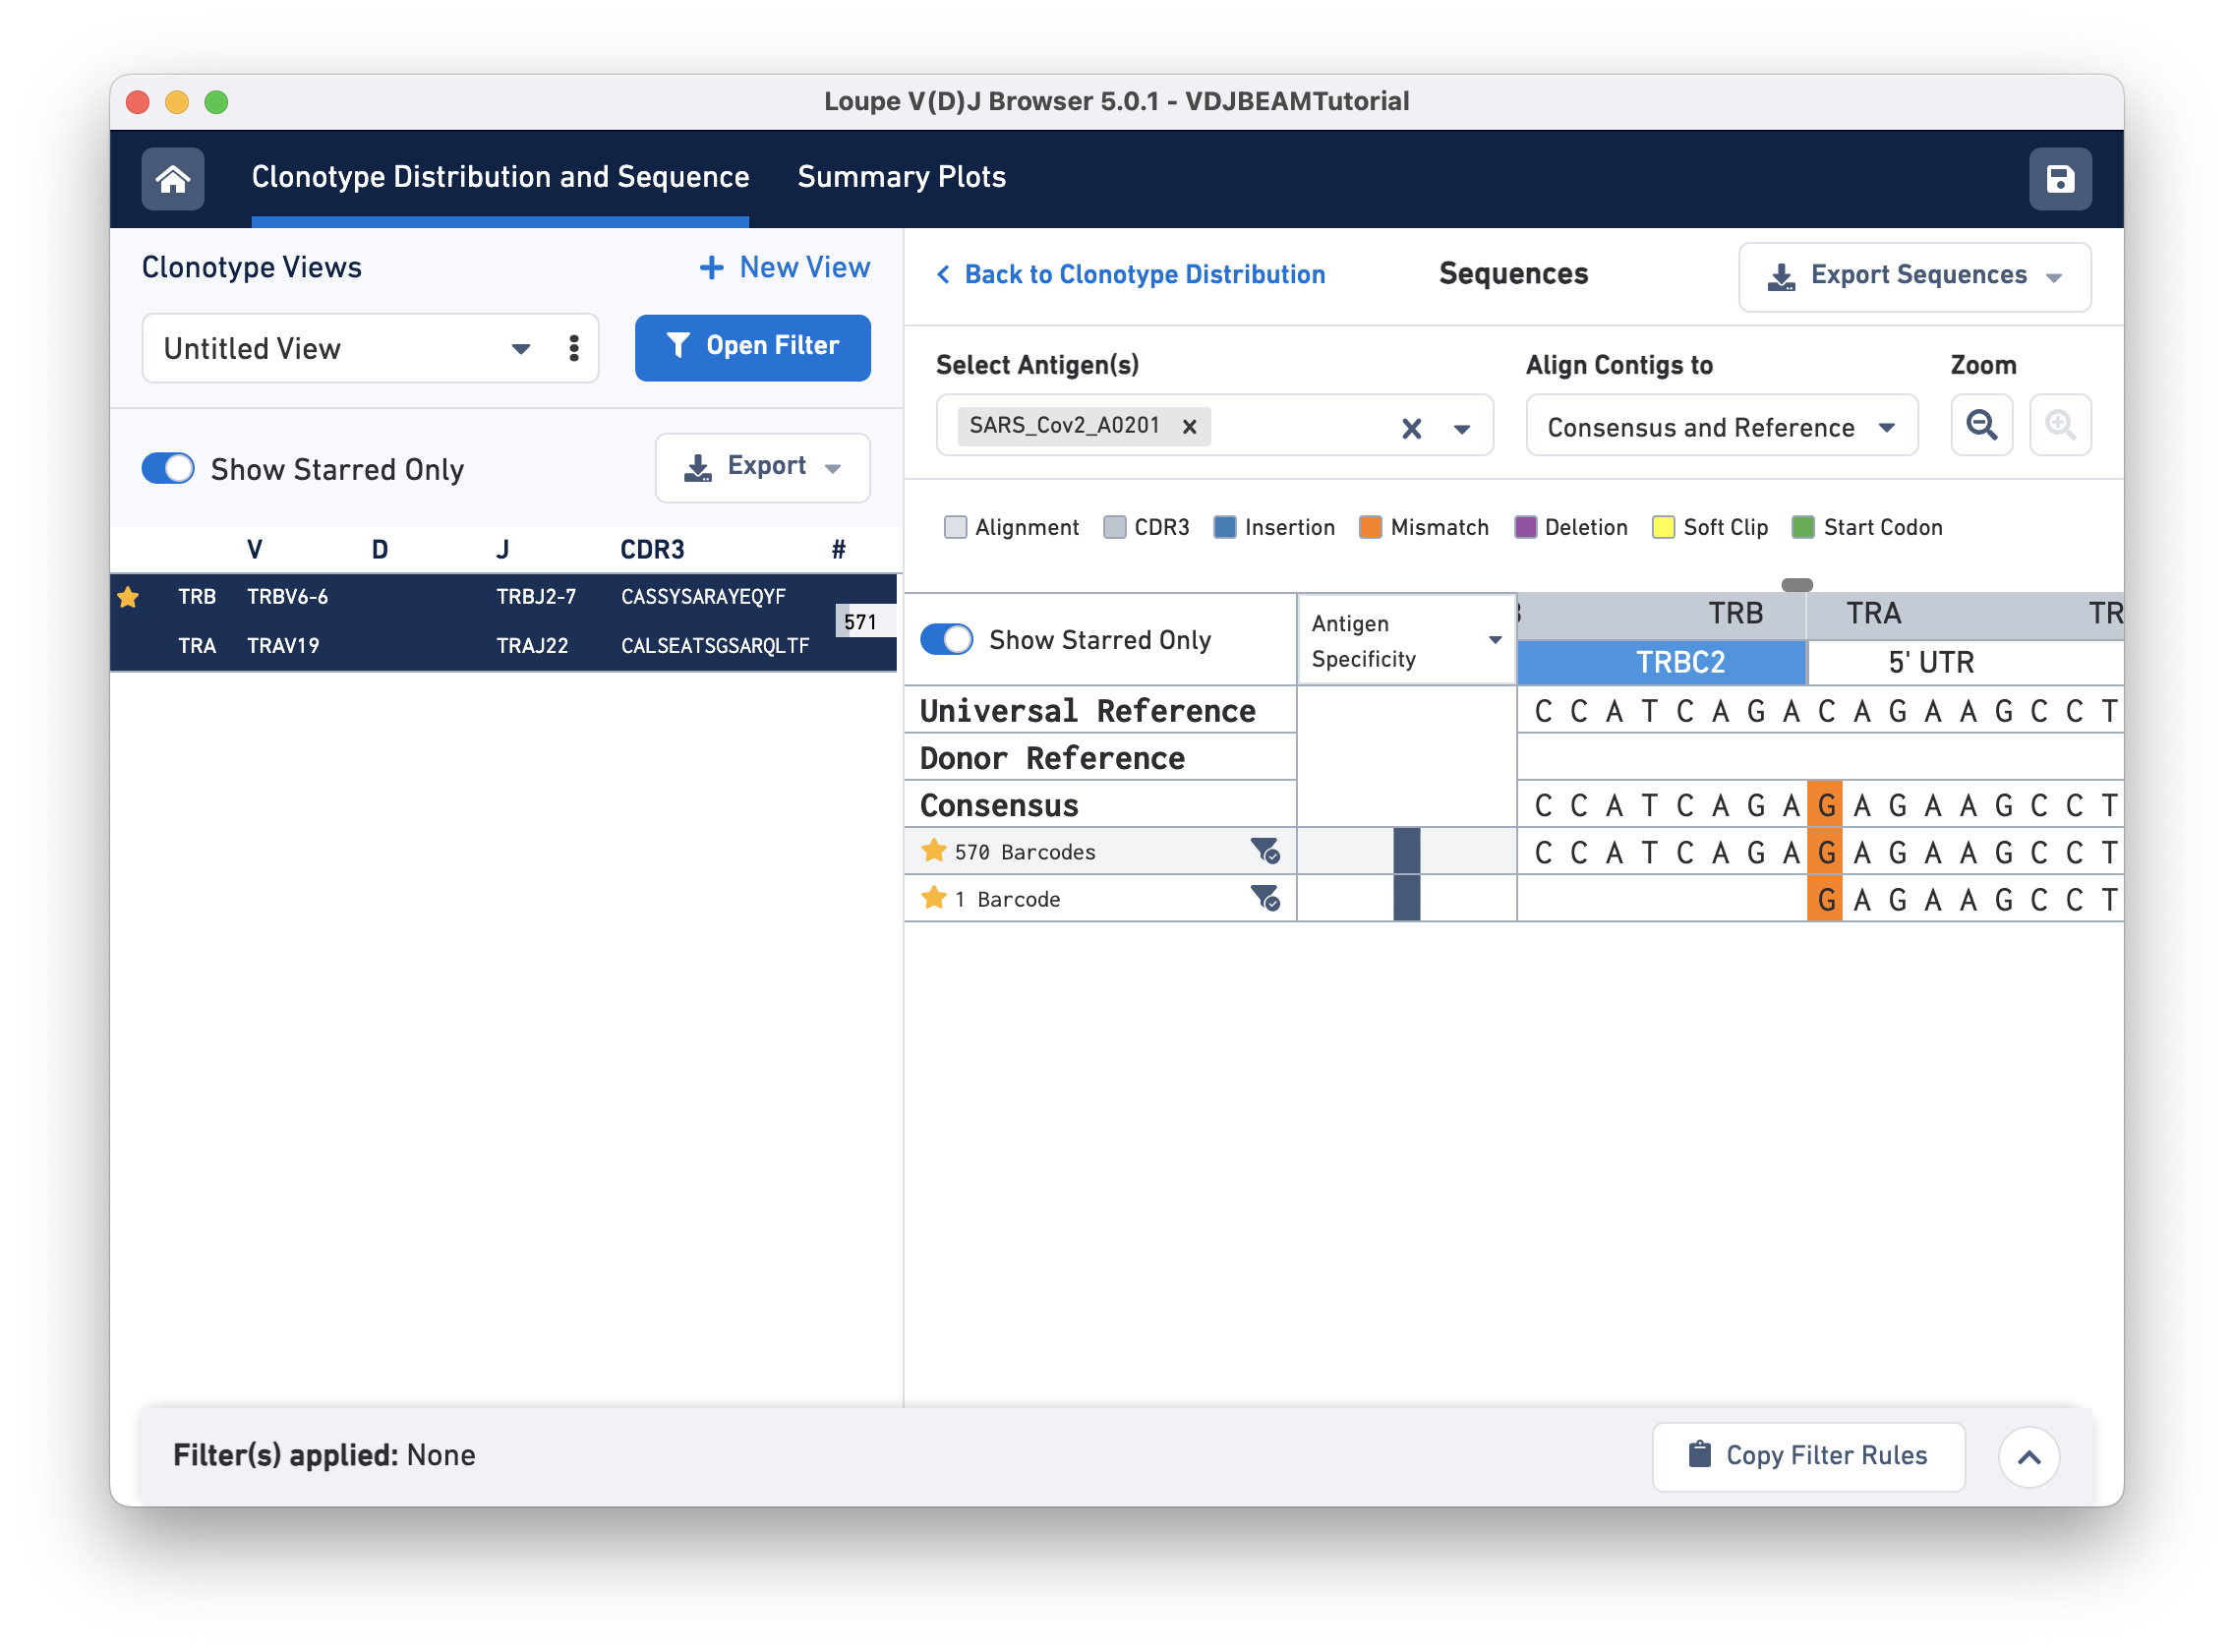
Switch back to Align Contigs and Consensus to Reference, then click on the TRB region of the alignment for any exact subclonotype or reference to bring up the nucleotide alignment. There is a scroll bar at the top of the sequence alignment; you can scroll side-to-side to examine the alignment more closely. At the start of the sequence (left), notice that the last row (second exact subclonotype with one barcode) is missing a TRB chain. Scrolling through, you will find an insertion in the first exact subclonotypes at the start of the TRBJ2-7 gene. This insertion is present in the consensus sequence, but it is absent in the universal reference. There is also a single mismatch (orange) in the 5' UTR of the TRA chain. The universal reference base at this location is a C, both exact subclonotypes have a G, and the consensus at this location shows an A base (shown below):
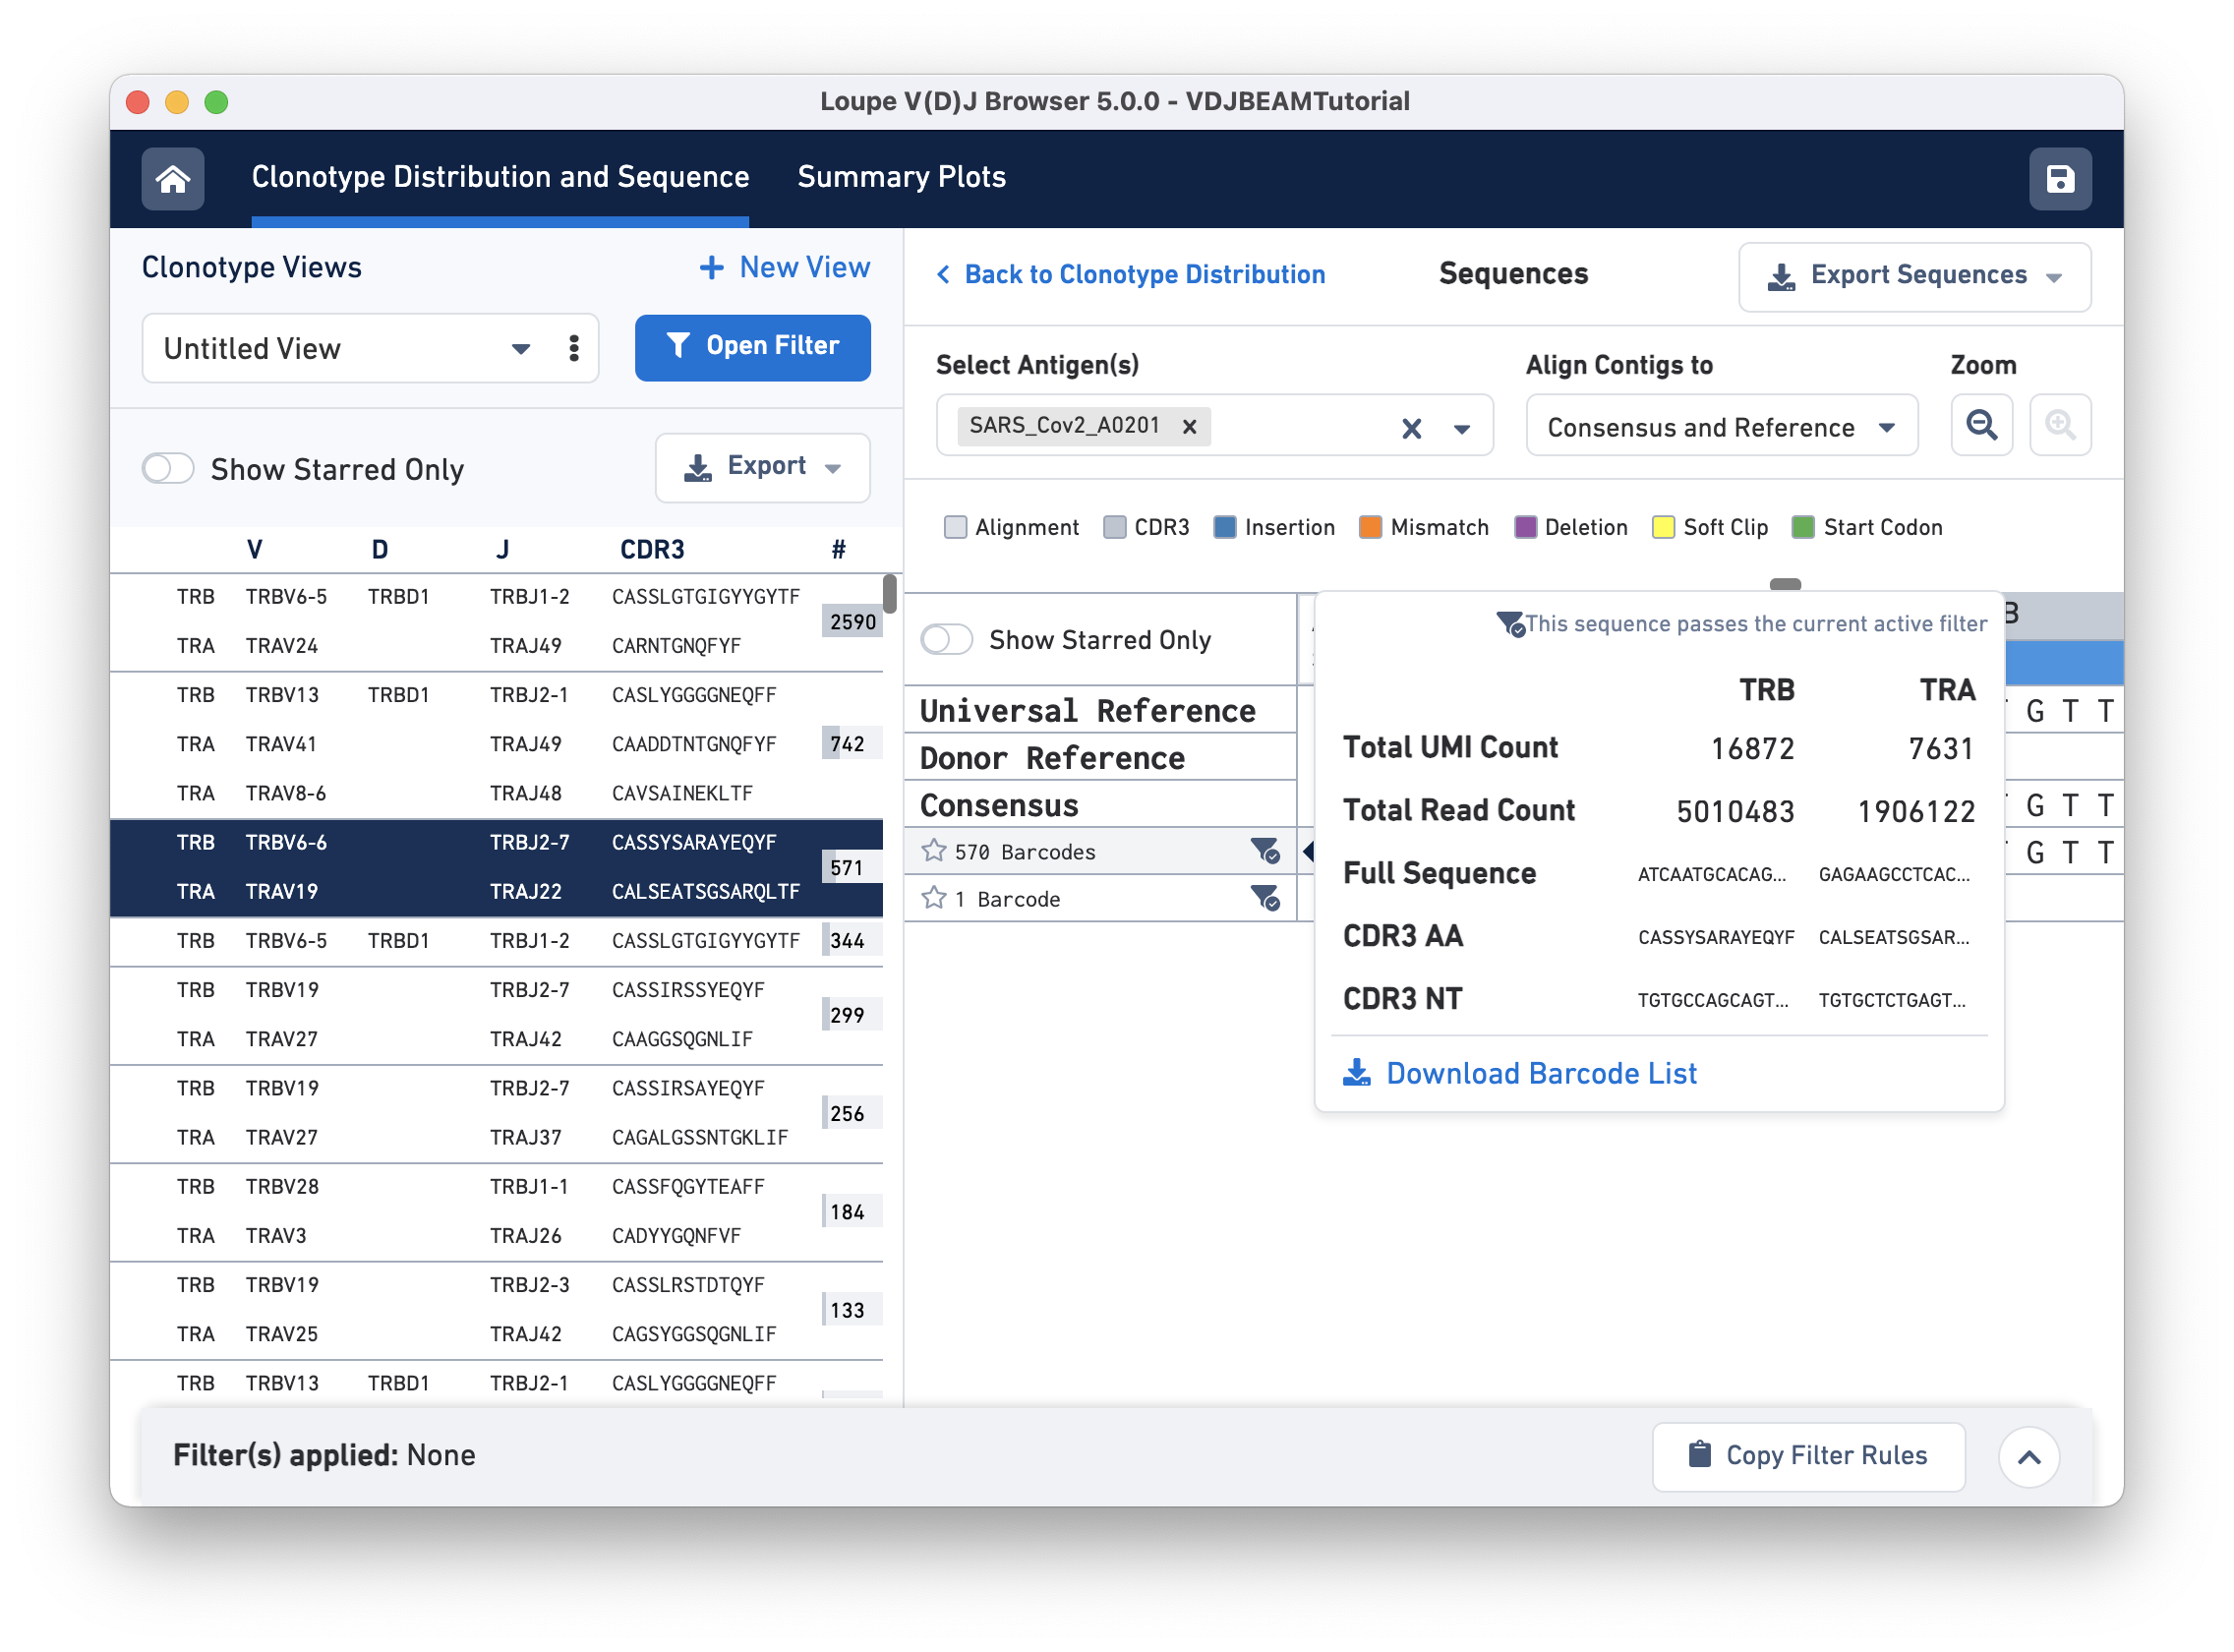
The amino acid and nucleotide sequence of the CDR3 for each exact subclonotype can be viewed or copied to the clipboard by hovering on the respective row names. The CDR3 shown is always the CDR3 of the consensus, regardless of the contig alignment setting.
This pop-up window also includes other metadata:
Clicking on any of these fields will copy them to your clipboard. It may be useful to copy the contig sequence into the bioinformatics tools of your choice. Click the Download Barcode List button to create a CSV with the full list of barcodes in the current exact subclonotype.
In the top right of the Sequences view panel, you will see an Export Sequences button. Clicking on it will allow you to download metadata and sequences in this view (nucleotide and amino acid for exact subclonotype contigs) to a CSV file.
Now that we have identified the dominant COVID-reactive clonotype, you may be interested in asking whether clonotypes in your dataset associate with more than one antigen. We can examine this visually using the many filtration options in the new Loupe V(D)J browser v5.0.
First, make sure that the cells in the Clonotype Distribution plot are colored by the Antigen Specificity score using the Color cells by section at the top of the Clonotype Distribution plot. If you are following along from earlier sections, you should not have to change the Color cells by setting again.
Next, open the filter window by clicking the Filter(s) applied bar at the bottom of the browser. To identify clonotypes that have a high antigen specificity score to the CMV antigen, set the Antigen Specificity filter range for CMV_A0201 to 90-100. You will see that colors in the Clonotype Distribution plot change; the large clonotype that had high specificity to SARS-CoV-2 is now grayed out, suggesting that the clonotype that has a high antigen specificity score for the COVID antigen does not have a high specificity score for the CMV antigen. Use the reset button on the top of the plot to remove COVID-antigen-based highlighting.
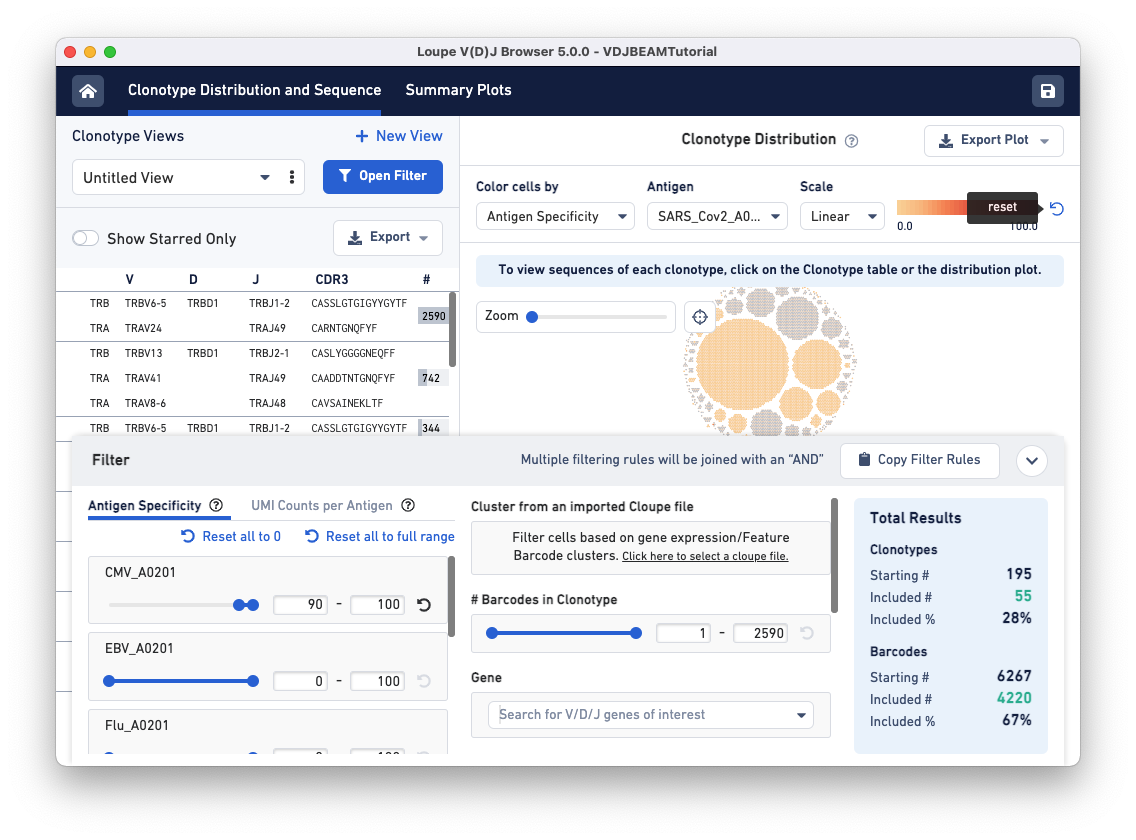
Now, CMV-reactive cells with an antigen specificity score between 90-100 are highlighted in dark blue. According to the Total Results panel (blue box on the right), 195 clonotypes pass the filtration criteria, some of which appear to have only one cell (singletons). To filter out the singletons and other smaller clonotypes (with < 50 cells), set the Barcodes in Clonotype filter range (middle panel) to 50-2590. As you can see, we are left with five clonotypes comprising CMV reactive cells, and this set includes the largest clonotype in the dataset with 2590 cellular barcodes.
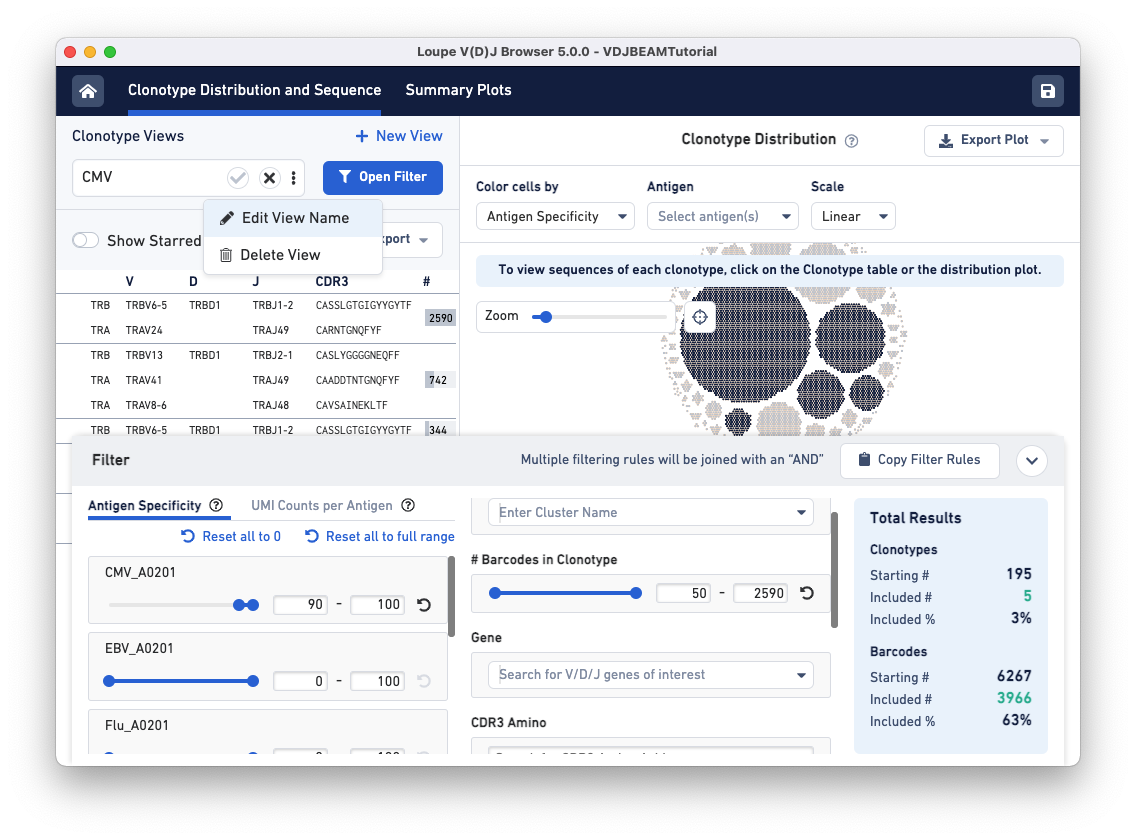
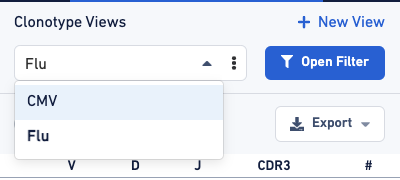
To save this filter for future use, click on the three dots under the Clonotype Views panel (top left) and select Edit View Name. Name this filter CMV and click the checkmark to save.
To find clonotypes that have a high antigen specificity score for the Flu antigen, repeat the same steps but manipulate the range for the Flu_A0201 antigen under the Antigen Specificity filter.
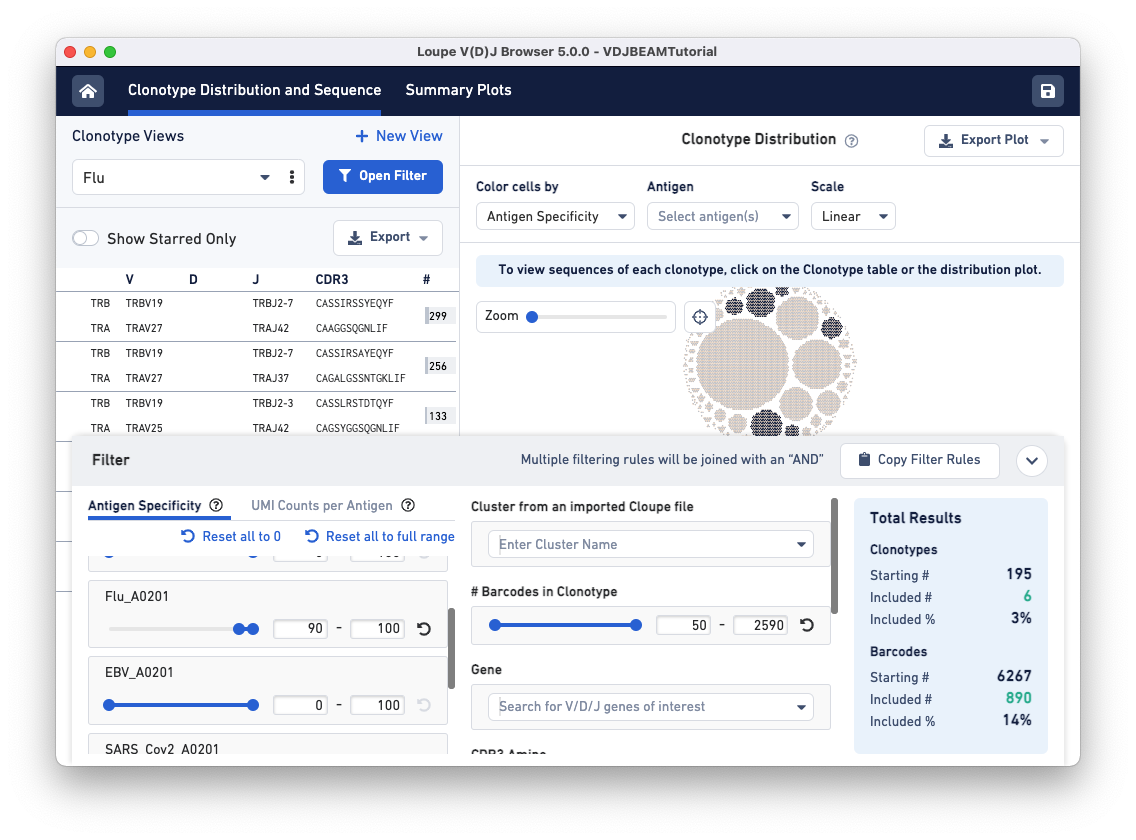
Use the drop-down menu option under Clonotype Views to switch between the two filtered views you just created.
If you have a matching 5′ Gene Expression dataset, you can load the .cloupe file generated by cellranger count or cellranger multi into the Loupe V(D)J Browser to filter the clonotype list by clusters created in Loupe Browser. To learn how to do this as well as other analyses with matching 5′ Gene Expression and V(D)J data, check out the Loupe Integrated Gene Expression and V(D)J Analysis Tutorial.